[Java] java.lang.OutOfMemoryError
java.lang.OutOfMemoryError: GC overhead limit exceeded
Java runtime environment contains a built-in Garbage Collection (GC) process. In many other programming languages, the developers need to manually allocate and free memory regions so that the freed memory can be reused.
Java applications on the other hand only need to allocate memory. Whenever a particular space in memory is no longer used, a separate process called Garbage Collection clears the memory for them. How the GC detects that a particular part of memory is explained in more detail in the Garbage Collection Handbook, but you can trust the GC to do its job well.
The java.lang.OutOfMemoryError: GC overhead limit exceeded error is displayed when your application has exhausted pretty much all the available memory and GC has repeatedly failed to clean it.
What is causing it?
The java.lang.OutOfMemoryError: GC overhead limit exceeded error is the JVM’s way of signalling that your application spends too much time doing garbage collection with too little result. By default the JVM is configured to throw this error if it spends more than 98% of the total time doing GC and when after the GC only less than 2% of the heap is recovered.
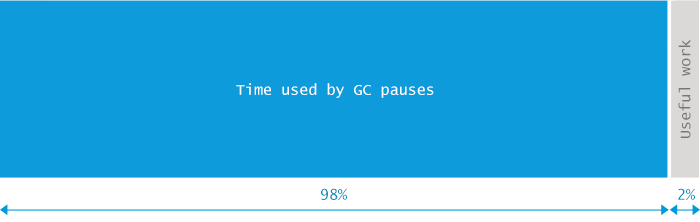
What would happen if this GC overhead limit would not exist? Note that the java.lang.OutOfMemoryError: GC overhead limit exceeded error is only thrown when 2% of the memory is freed after several GC cycles. This means that the small amount of heap the GC is able to clean will likely be quickly filled again, forcing the GC to restart the cleaning process again. This forms a vicious cycle where the CPU is 100% busy with GC and no actual work can be done. End users of the application face extreme slowdowns – operations which normally complete in milliseconds take minutes to finish.
So the “java.lang.OutOfMemoryError: GC overhead limit exceeded” message is a pretty nice example of a fail fast principle in action.
Give me an example
In the following example we create a “GC overhead limit exceeded” error by initializing a Map and adding key-value pairs into the map in an unterminated loop:
package com.cncounter.rtime;

import java.util.Map;
import java.util.Random;

public class TestWrapper {
    public static void main(String args[]) throws Exception {
        Map map = System.getProperties();
        Random r = new Random();
        while (true) {
            map.put(r.nextInt(), "value");
        }
    }
}
Exception in thread "main" java.lang.OutOfMemoryError: GC overhead limit exceeded
	at java.util.Hashtable.addEntry(Hashtable.java:435)
	at java.util.Hashtable.put(Hashtable.java:476)
	at com.cncounter.rtime.TestWrapper.main(TestWrapper.java:11)
As you might guess this cannot end well. And, indeed, when we launch the above program with:
java -Xmx12m -XX:+UseParallelGC TestWrapper
we soon face the java.lang.OutOfMemoryError: GC overhead limit exceeded message. But the above example is tricky. When launched with different Java heap size or a different GC algorithm, my Mac OS X 10.9.2 with Hotspot 1.7.0_45 will choose to die differently. For example, when I run the program with smaller Java heap size like this:
java -Xmx10m -XX:+UseParallelGC TestWrapper
Exception in thread "main" java.lang.OutOfMemoryError: Java heap space
	at java.util.Hashtable.rehash(Hashtable.java:401)
	at java.util.Hashtable.addEntry(Hashtable.java:425)
	at java.util.Hashtable.put(Hashtable.java:476)
	at com.cncounter.rtime.TestWrapper.main(TestWrapper.java:11)
the application will die with a more common java.lang.OutOfMemoryError: Java heap space message that is thrown on Map resize. And when I run it with other garbage collection algorithms besides ParallelGC, such as -XX:+UseConcMarkSweepGC or -XX:+UseG1GC, the error is caught by the default exception handler and is without stacktrace as the heap is exhausted to the extent where the stacktrace cannot even be filled on Exception creation.
These variations are truly good examples that demonstrate that in resource-constrained situations you cannot predict the way your application is going to die so do not base your expectations on a specific sequence of actions to be completed.
What is the solution?
As a tongue-in-cheek solution, if you just wished to get rid of the “java.lang.OutOfMemoryError: GC overhead limit exceeded” message, adding the following to your startup scripts would achieve just that:
-XX:-UseGCOverheadLimit
I would strongly suggest NOT to use this option though instead of fixing the problem you just postpone the inevitable: the application running out of memory and needing to be fixed. Specifying this option will just mask the original java.lang.OutOfMemoryError: GC overhead limit exceeded error with a more familiar message java.lang.OutOfMemoryError: Java heap space.
On a more serious note sometimes the GC overhead limit error is triggered because the amount of heap you have allocated to your JVM is just not enough to accommodate the needs of your applications running on that JVM. In that case, you should just allocate more heap see at the end of this chapter for how to achieve that.
In many cases however, providing more Java heap space will not solve the problem. For example, if your application contains a memory leak, adding more heap will just postpone the java.lang.OutOfMemoryError: Java heap space error. Additionally, increasing the amount of Java heap space also tends to increase the length of GC pauses affecting your application’s throughput or latency.
If you wish to solve the underlying problem with the Java heap space instead of masking the symptoms, you need to figure out which part of your code is responsible for allocating the most memory. In other words, you need to answer these questions:
- Which objects occupy large portions of heap.
- where these objects are being allocated in source code.
At this point, make sure to clear a couple of days in your calendar (or see an automated way below the bullet list). Here is a rough process outline that will help you answer the above questions:
- Get clearance for acquiring a heap dump from your JVM-to-troubleshoot. “Dumps” are basically snapshots of heap contents that you can analyze, and contain everything that the application kept in memory at the time of the dump. Including passwords, credit card numbers etc.
- Instruct your JVM to dump the contents of its heap memory into a file. Be prepared to get a few dumps, as when taken at a wrong time, heap dumps contain a significant amount of noise and can be practically useless. On the other hand, every heap dump “freezes” the JVM entirely, so don’t take too many of them or your end users start swearing.
- Find a machine that can load the dump. When your JVM-to-troubleshoot uses for example 8GB of heap, you need a machine with more than 8GB to be able to analyze heap contents. Fire up dump analysis software (we recommend Eclipse MAT, but there are also equally good alternatives available).
- Detect the paths to GC roots of the biggest consumers of heap. We have covered this activity in a separate post here. Don’t worry, it will feel cumbersome at first, but you’ll get better after spending a few days digging.
- Next, you need to figure out where in your source code the potentially hazardous large amount of objects is being allocated. If you have good knowledge of your application’s source code you’ll hopefully be able to do this in a couple searches. When you have less luck, you will need some energy drinks to assist.
Alternatively, we suggest Plumbr, the only Java monitoring solution with automatic root cause detection. Among other performance problems it catches all java.lang.OutOfMemoryErrors and automatically hands you the information about the most memory-hungry data structres. It takes care of gathering the necessary data behind the scenes this includes the relevant data about heap usage (only the object layout graph, no actual data), and also some data that you can’t even find in a heap dump. It also does the necessary data processing for you on the fly, as soon as the JVM encounters an java.lang.OutOfMemoryError. Here is an example java.lang.OutOfMemoryError incident alert from Plumbr:
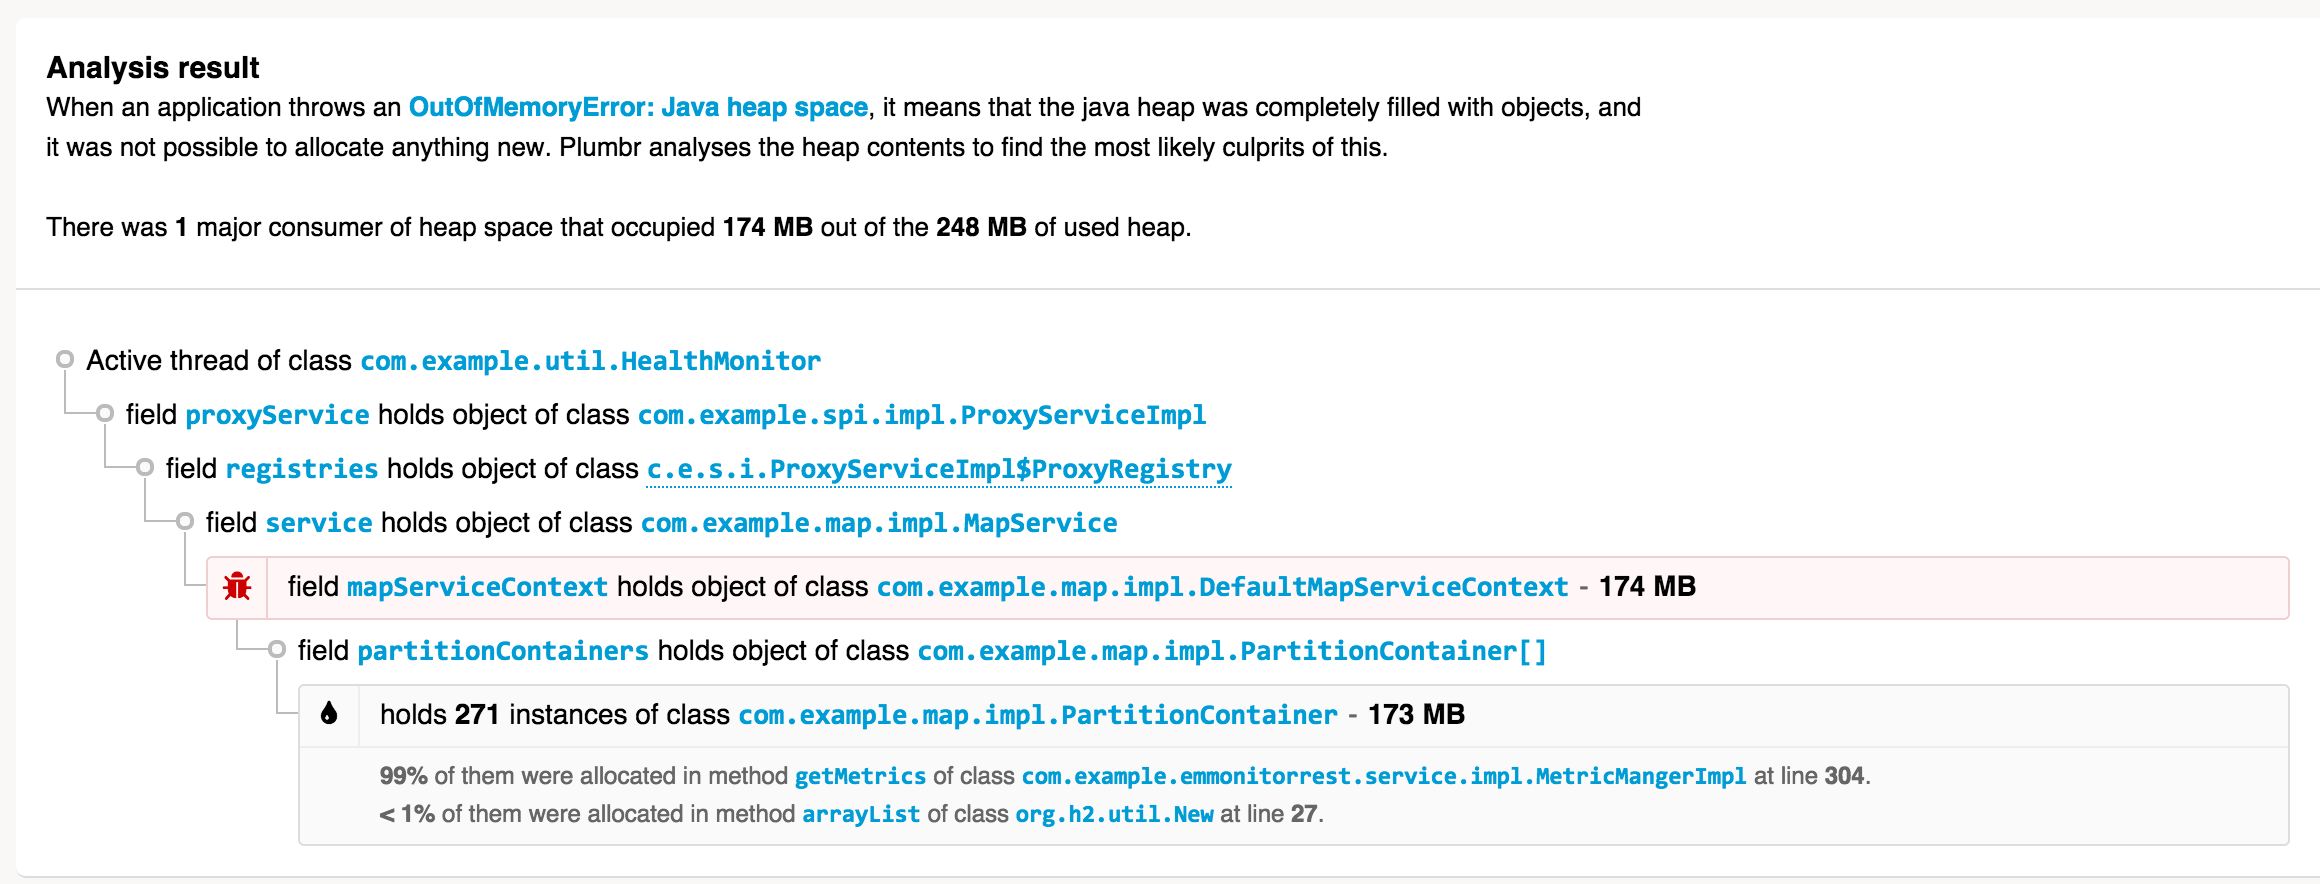
Without any additional tooling or analysis you can see:
- Which objects are consuming the most memory (271
com.example.map.impl.PartitionContainerinstances consume 173MB out of 248MB total heap). - Where these objects were allocated (most of them allocated in the MetricManagerImpl class, line 304).
- What is currently referencing these objects (the full reference chain up to GC root).
Equipped with this information you can zoom in to the underlying root cause and make sure the data structures are trimmed down to the levels where they would fit nicely into your memory pools.
However, when your conclusion from memory analysis or from reading the Plumbr report are that memory use is legal and there is nothing to change in the source code, you need to allow your JVM more Java heap space to run properly. In this case, alter your JVM launch configuration and add (or increase the value if present) just one parameter in your startup scripts:
java -Xmx1024m com.yourcompany.YourClass
In the above example the Java process is given 1GB of heap. Modify the value as best fits to your JVM. However, if the result is that your JVM still dies with OutOfMemoryError, you might still not be able to avoid the manual or Plumbr-assisted analysis described above.