[Java] java.lang.OutOfMemoryError
java.lang.OutOfMemoryError: Permgen space
Java applications are only allowed to use a limited amount of memory. The exact amount of memory your particular application can use is specified during application startup. To make things more complex, Java memory is separated into different regions which can be seen in the following figure:
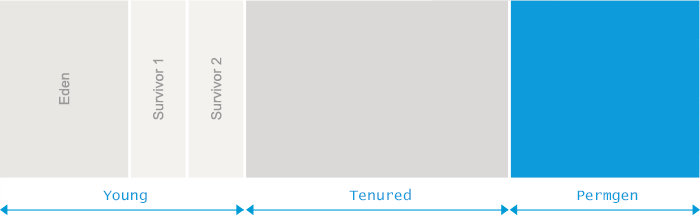
The size of all those regions, including the permgen area, is set during the JVM launch. If you do not set the sizes yourself, platform-specific defaults will be used.
The java.lang.OutOfMemoryError: PermGen space message indicates that the Permanent Generation’s area in memory is exhausted.
What is causing it?
To understand the cause for the java.lang.OutOfMemoryError: PermGen space, we would need to understand what this specific memory area is used for.
For practical purposes, the permanent generation consists mostly of class declarations loaded and stored into PermGen. This includes the name and fields of the class, methods with the method bytecode, constant pool information, object arrays and type arrays associated with a class and Just In Time compiler optimizations.
From the above definition you can deduce that the PermGen size requirements depend both on the number of classes loaded as well as the size of such class declarations. Therefore we can say that the main cause for the java.lang.OutOfMemoryError: PermGen space is that either too many classes or too big classes are loaded to the permanent generation.
Give me an example
Minimalistic example
As we described above, PermGen space usage is strongly correlated with the number of classes loaded into the JVM. The following code serves as the most straightforward example:
import javassist.ClassPool;

public class MicroGenerator {
  public static void main(String[] args) throws Exception {
    for (int i = 0; i < 100_000_000; i++) {
      generate("eu.plumbr.demo.Generated" + i);
    }
  }

  public static Class generate(String name) throws Exception {
    ClassPool pool = ClassPool.getDefault();
    return pool.makeClass(name).toClass();
  }
}
In this example the source code iterates over a loop and generates classes at runtime. Class generation complexity is being taken care of by the javassist library.
Launching the code above will keep generating new classes and loading their definitions into Permgen space until the space is fully utilized and the java.lang.OutOfMemoryError: Permgen space is thrown.
Redeploy-time example
For a bit more complex and more realistic example, lets walk you through a java.lang.OutOfMemoryError: Permgen space error occurring during the application redeploy. When you redeploy an application, you would expect that Garbage Collection will get rid of the previous classloader referencing all the previously loaded classes and it gets replaced with a classloader loading new versions of the classes.
Unfortunately many 3rd party libraries and poor handling of resources such as threads, JDBC drivers or filesystem handles makes unloading the previously used classloader impossible. This in turn means that during each redeploy all the previous versions of your classes will still reside in PermGen generating tens of megabytes of garbage during each redeploy.
Let’s imagine an example application that connects to a relational database using JDBC drivers. When the application is started, the initializing code loads the JDBC driver to connect to the database. Corresponding to the specification, the JDBC driver registers itself with java.sql.DriverManager. This registration includes storing a reference to an instance of the driver inside a static field of DriverManager.
Now, when the application is undeployed from the application server, java.sql.DriverManager will still hold that reference. We end up having a live reference to the driver class which in turn holds reference to the instance of java.lang.Classloader used to load the application. This in turn means that the Garbage Collection Algorithms are not able to reclaim the space.
And that instance of java.lang.ClassLoader still references all classes of the application, usually occupying tens of megabytes in PermGen. Which means that it would take just a handful of redeploys to fill a typically sized PermGen and get the java.lang.OutOfMemoryError: PermGen space error message in your logs.
What is the solution?
1. Solving initialization-time OutOfMemoryError
When the OutOfMemoryError due to PermGen exhaustion is triggered during the application launch, the solution is simple. The application just needs more room to load all the classes to the PermGen area so we just need to increase its size. To do so, alter your application launch configuration and add (or increase if present) the -XX:MaxPermSize parameter similar to the following example:
java -XX:MaxPermSize=512m com.yourcompany.YourClass
The above configuration will tell the JVM that PermGen is allowed to grow up to 512MB before it can start complaining in the form of OutOfMemoryError.
2. Solving redeploy-time OutOfMemoryError
For those who cannot use Plumbr or decide not to, alternatives are also available. For this, you should proceed with heap dump analysis take the heap dump after a redeploy with a command similar to this one:
jmap -dump:format=b,file=dump.hprof <process-id>
Then open the dump with your favourite heap dump analyzer (Eclipse MAT is a good tool for that). In the analyzer, you can look for duplicate classes, especially those loading your application classes. From there, you need to progress to all classloaders to find the currently active classloader.
For the inactive classloaders, you need to determine the reference blocking them from being Garbage Collected via harvesting the shortest path to GC root from the inactive classloaders. Equipped with this information you will have found the root cause. In case the root cause was in a 3rd party library, you can proceed to Google/StackOverflow to see if this is a known issue to get a patch/workaround. If this was your own code, you need to get rid of the offending reference.
3. Solving run-time OutOfMemoryError
An alternative way for those once again who cannot use Plumbr is also available. First step in such case is to check whether the GC is allowed to unload classes from PermGen. The standard JVM is rather conservative in this regard classes are born to live forever. So once loaded, classes stay in memory even if no code is using them anymore. This can become a problem when the application creates lots of classes dynamically and the generated classes are not needed for longer periods. In such a case, allowing the JVM to unload class definitions can be helpful. This can be achieved by adding just one configuration parameter to your startup scripts:
-XX:+CMSClassUnloadingEnabled
By default this is set to false and so to enable this you need to explicitly set the following option in Java options. If you enable CMSClassUnloadingEnabled, GC will sweep PermGen too and remove classes which are no longer used. Keep in mind that this option will work only when UseConcMarkSweepGC is also enabled using the below option. So when running ParallelGC or, God forbid, Serial GC, make sure you have set your GC to CMS by specifying:
-XX:+UseConcMarkSweepGC
After making sure classes can be unloaded and the issue still persists, you should proceed with heap dump analysis taking the heap dump with a command similar to following:
jmap -dump:file=dump.hprof,format=b <process-id>
Then opening the dump with your favorite heap dump analyzer (e.g. Eclipse MAT) and progressing to find the most expensive classloaders by the number of classes loaded. From such classloaders, you can proceed to extract the loaded classes and sort such classes by the instances to have the top list of suspects.
For each suspect, you then need to manually trace the root cause back to your application code that generates such classes.